
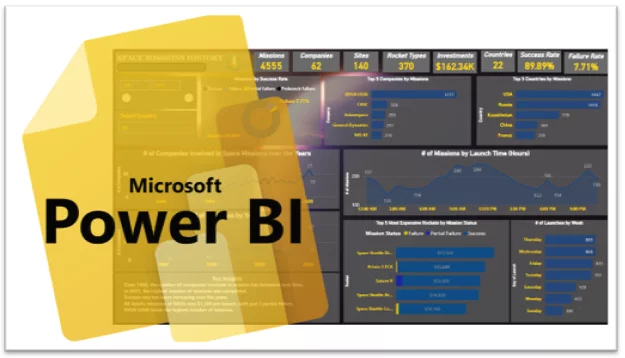
You Should Learn Power BI [How And Why]
Contents

Power BI stands for Power Business Intelligence.
It is the leading business intelligence and data visualization tool.
Microsoft Power BI’s transforms data from multiple sources into actionable insights.
It is used by business analysts, business intelligence analysts and supply chain analysts.
Benefits Of Learning Power BI
Learning Microsoft Power BI gives you the cutting-edge skills to prepare, model, and visualize data from multiple sources. Here are some of the benefits of learning power bi.
- In-Demand Skill: Power BI is an in-demand skill with lots of hiring opportunities.
- Career Pathway: Power BI is the first step to multiple career pathways.
- Versatility: Microsoft Power BI is the best platform across multiple industries and sectors.
- Employability: Learning Power BI and earning the PL-300 Data Analyst certification increases your employability rate as it proves to most business analytics employers that you have the required skills needed as an analyst.
- Value: Having Microsoft Power BI training increases your value in your organization.
Power BI’s Versatility
Microsoft Power BI has diverse and multiple applications across various sectors including banking and finance for financial analysis and reporting.
Healthcare for improving clinical decision-making and patient outcomes, and education to monitor students’ performance and efficiency of training.
With the ability to connect to hundreds of different data sources and large-scale datasets as huge as 10GB and more on the enterprise subscription, Microsoft Power BI is capable of meeting different business requirements and needs.
Power BI For Data Analysis
Data-driven analytics is the core strength of Microsoft Power BI for effective business solutions. It is important in data-driven roles to increase productivity and unlock the full potential of business data for better strategic decisions.
The process of data organization, transformation, and analysis within the Microsoft Power BI desktop involves extracting, transforming, and loading the data.
Data Extraction: Raw data from different data sources can be connected from the Get Data tab on the Microsoft Power BI desktop and organized and structured into rows and columns.
Data Transformation: You can use Power query to transform the data by applying different cleaning, shaping, and enrichment techniques available in the Power query editor.
Data Loading: Finally, you will load the transformed data into Microsoft Power BI for further analysis and insights.
Power Query, DAX And Data Modelling In Power BI
Power Query is a huge feature inside of the Power BI desktop that allows analysts to shape, clean, and transform data from various sources before analysis.
Data Analysis Expression, popularly called DAX, is primarily used in Power BI to manipulate Power BI datasets and creates complex calculations for aggregation, filtering, and summarizing data to derive actionable insights.
Building a good and efficient data model is essential for building Power BI reports that are optimizable for performance and easily scalable with new data in the future. Data models allow easy connections of multiple data sources through table relationships that will eventually be used in creating reports and visualization.
Professionals involved in data-driven and decision-making roles use Microsoft Power BI to streamline data management processes and effectively track and analyze data points to uncover actionable insights helpful for business intelligence.

Automation And Productivity
Power BI boosts productivity through automation and helps streamline some data analysis processes with minimal or zero input from analysts or Power BI developers.
Features such as data refresh scheduling provide various options to schedule refresh in Power BI Desktop and Power BI service to always have your reports up to date with the most recent datasets.
Reusable data models make it easy to reuse data models across multiple reports and dashboards, ensuring consistency and saving time in report development.
The Power Query editor offers several tools, and functions for simple data formatting to complex data transformation to streamline data cleaning and create M language codes that can be used to repeat, automate, and transform data into structured format for analysis.
A well-designed data model is scalable and flexible to changes in data sources. It incorporates new data, dimensions, and measures without disrupting existing analyses, saving time and reducing errors.
Power BI – How To Learn
Power BI courses are all over the internet, so enrolling in a well-structured and comprehensive Power BI training might be challenging. Find below some top-notch power bi courses to help you get started:

- Our top-rated Power BI Courses.
- Getting Started with Power BI on Microsoft Learn.
- A Beginners Guide to Learning Power BI the Right Way on Simplilearn.
- Getting Started with Power BI Desktop on Coursera.
Top books to learn Power BI and advance your business intelligence and data analytics knowledge.
- Analyzing Data with Power BI and Power Pivot for Excel by Alberto Ferrari and Marco Russo: Covers in-depth guidance on using Power BI and Power Pivot to analyze data.
- Super Charge Power BI: Power BI is Better When you Learn to Write DAX by Matt Allington: Focuses on mastering data analysis expression (DAX) to unlock the full potential of Power BI.
- The Definitive Guide to DAX: Business Intelligence with Microsoft Excel, SQL Server Analysis Service, and Power BI by Alberto Ferrari and Marco Russo: A comprehensive coverage of the DAX language, essential for creating calculated columns and measures in Power BI.
Learn power BI by doing, with hands-on practice and real-world data to grasp and understand the full potential of the business intelligence platform.
The most common real-world datasets and Power BI case studies online include:
- Sales Analytics.
- E-commerce Sales.
- HR Attrition.
- Road Accident Analysis.
- Customer Churn Analysis.
- Trend Analysis.
Joining Power BI communities, forums are a great way to find help and solutions when you face challenges and need to troubleshoot some advanced Power BI issues.
Attending Power BI training sessions and workshops for ongoing learning and support is highly recommended!
Learning Power BI
This is a clear and comprehensive road map.
It will give you the absolute knowledge to harness the full potential of the business intelligence platform.
Start to learn Power BI by following the structured guide below:
Introduction to Power BI: Learn Power BI basics on how to navigate through the most powerful business intelligence platform. Learn power bi data connections including how to connect to multiple data sources. Understand the interface such as the tabs on the ribbon, the report, table, model, and Data Analysis Expressions DAX views.
Data Preparation in Power BI: Focus and learn Power BI data profiling features with power query, use to preview and understand data structures from the data source before proceeding to shaping, and manipulating the data before analysis.
Data Transformation in Power BI: How to transform and combine datasets from multiple data sources is a key concept to understanding Power BI. Learn power BI (un)pivot, transpose, append and join table features in power query. Understand concepts like creating custom columns, M language, and advanced editor.
Data Modeling in Power BI: Data models in Power BI involve shaping, defining tables, and understanding the difference between dimensions and facts tables. Also power bi most popular data model structure: star schema and snowflake schemas, how to create relationships between tables and identify performance problems using the performance analyzer in Power BI.
DAX in Power BI: Data Analysis Expressions (DAX) allows you to take your Power BI skills to the next level. Learn power BI filtering, counting, logical, and iterating functions to calculate and gain insights from your datasets. Table manipulation, time intelligence functions, and row-level security are important concepts in learning Power BI.
Exploratory Data Analysis in Power BI: Identifying and using descriptive statistics to spot missing data, and outliers within datasets is possible with EDA in Power BI. EDA helps you grasp the relationship between categorical and continuous variables within your datasets. You will learn power bi imputation techniques to replace missing data.
Data Visualization, Reports, and Reports Design in Power BI: Power BI is a powerful data visualization and business intelligence platform. It contains extraordinary visuals that can be used in reports and dashboards to create insightful visualizations that show emotions and connect to users. Learn power bi-storytelling techniques called progressive disclosure to simplify dashboard building to make your reports interactive and behave like a web application.
Deploying and Maintaining Assets in Power BI Service: When you learn Power BI, you can deploy and maintain your reports from the Power BI desktop in Power Service: the cloud version of the business intelligence platform. Learn power BI service to understand the key interface of workspaces, secure and share content with role-level security, and mark datasets as sensitive, confidential, or public to ensure maximum data governance for your organization.
Conclusion
Power BI is a versatile and powerful business intelligence and data visualization tool that can be learned for personal, professional, and career growth.
Take a bold step and learn power BI today, to add value and position yourself for endless opportunities in the analytics industry.
As a top business intelligence platform, Power BI offers intuitive interface tools that make gaining actionable insights for business intelligence and decision-making flawless.


- Facebook: https://www.facebook.com/profile.php?id=100066814899655
- X (Twitter): https://twitter.com/AcuityTraining
- LinkedIn: https://www.linkedin.com/company/acuity-training/