
News & Tips
AllAdobe InDesignAdobe PhotoshopManagementMicrosoft ExcelMicrosoft Power AutomateMicrosoft Power BIMicrosoft PowerPointMicrosoft ProjectMicrosoft SharePointMicrosoft WordSQLTime Management

Writing Effective Emails [Forget The Fluff!]
Everyone uses email. But not many know how to write a persuasive email! For any role, especially management, this will be your most used communication method. Let’s learn when to email, and how to write a persuasive email. …

What Is A Line Manager? – Learn In Just 5 Minutes!
A line manager’s primary function is to: Ensure that their team operates efficiently. Read on and find out just what a line manager does, and what they need to do to be effective. All these skills are part of…

All About The Adobe Pen Tool
The Pen Tool is very basic but a very important tool in Photoshop and InDesign. You will use the Pen Tool all the time no matter what skill level you are! Pen Options There are 4 options to choose from:…

How To Know Your Audience As A Manager
Presenting well is a cornersone of good management. It will motivate and influence your team. The more you know about the audience, the more effect you can have on them. What Is Knowing Your Audience? “It is understanding that gives…

Top 10 Public Speakers (Worldwide!)
World leaders have the ability to inspire us, motivate us, shock us and even scare us. There is tremendous power in great public speaking. But some world leaders still haven’t ‘cracked the code’ and don’t hit the right mark when…

The Three C’s Of Good Communication
Communication is the key to being understood. As a manager, it is your most important skill. We spend a lot of time on our management courses, we believe any manager needs this skill. The Three C’s Of Communication Clear, Concise…

5 Tips – Improve Your Listening Skills
There is a huge difference between hearing someone and listening to them. Listening isn’t always easy. But it is a key part of being a manager and a team member. This goes hand in hand with our line manager courses,…

Building Rapport With Your Team [8 Quick Tips!]
Rapport is people’s ability to relate to others. Having good rapport means being empathetic towards each other’s feelings. Some people are gifted at it, but everyone can improve on it. Good rapport can be mastered on our Line Manager…

Difficult Conversations At Work [Handled In 5 Simple Steps]
At work, you’re going to have difficult conversations. But becoming good at them, will boost your career. From bad performance reviews, to having to let people go: Difficult conversations can’t be avoided. You can get personal coaching on our…

Communication Skills Statistics UK – Communication in the Workplace
Good communication makes us productive. Poor communication makes us frustrated. So how effective are we at communicating at work? We polled the public to find out how people communicate in the modern workplace. The Key Points – The most popular…

Assertiveness Statistics & Facts: NEW Research for 2024
Key Takeaways – 88% of people think that they are assertive at work. – Over half (55%) of people say they’ve missed work opportunities by not being assertive enough. – 57% of people say they’ve naturally become more assertive…
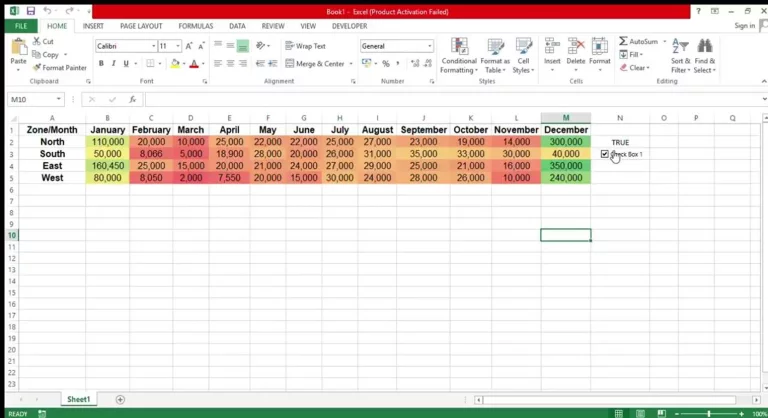
2 Ways To Make A Heat Map In Excel [Advanced Guide]
Heat Maps distinguish important figures through vibrant colours. They are a unique visualisation tool, they are approachable while keeping important data intact. On our advanced Microsoft Excel courses, you’ll learn all about heat maps with the help of our…