
News & Tips
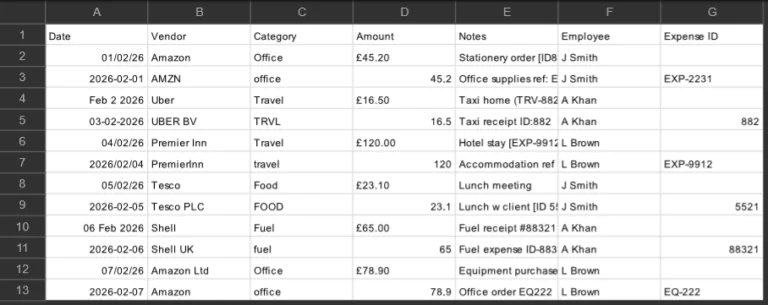
Building A Solid Data Cleaning Architecture: Guided Walkthrough
How does an Excel pro in 2026 turn messy data into a clean, reporting ready dataset? They design a complete, repeatable system. Modern Excel expertise isn’t just knowing formulas, it’s understanding how Excel works in the real world. Importing messy…

Excel’s New Functions Are Changing How We Work (2026 Guide)
Most of us learned Excel ages ago, and haven’t done much new since then – this goes for businesses and workers. For a very long time, most workplaces used Excel in more or less the same way. SUM formulas, VLOOKUPs,…

REGEXTEST: Checking Your Regex Works In Excel
Regex is one of the most powerful additions to modern Excel, but it has a real learning curve to it! Sometimes you’ll write what looks like the perfect patten, just to realise it isn’t doing what you expected. When you’re…
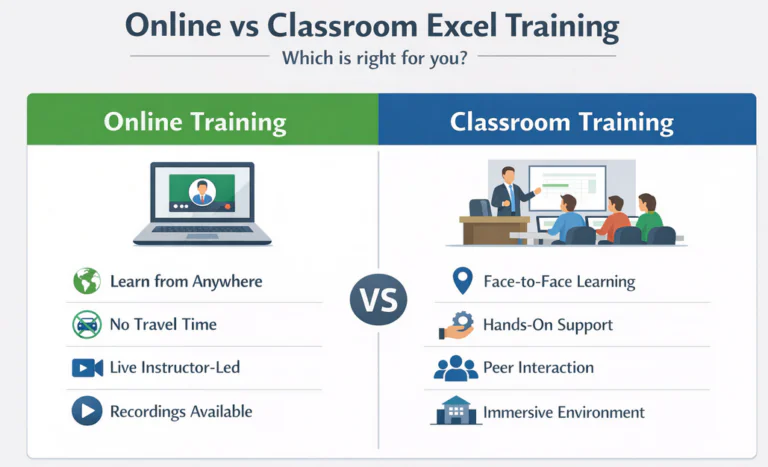
Online vs Classroom Excel Training – Which Format Should You Choose?
When it comes to improving your spreadsheet skills, the question isn’t just which course to take, but which format to learn in. Excel is at the centre of so many businesses, and selecting the right delivery will make a big…
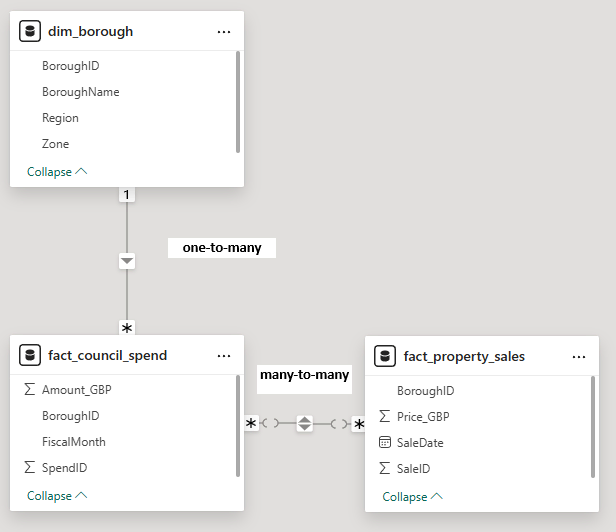
Power BI Relationships Explained (And Why “Many-to-Many” Is Almost Always Wrong!)
Relationships sit at the heart of literally everything you do in Power BI. Before you make measures, visuals and reports, relationships are established to define how your data fits together. Their job is simple on the surface – but vital:…

Using REGEXEXTRACT To Pull The Exact Data You Need
If you’ve used Excel with data exported from a CRM, you’ll know it doesn’t ever come the way you want it to! Order references get mixed up with descriptions, IDs get buried inside notes, and codes sit inside brackets or…

Regex in Excel & REGEXREPLACE
Microsoft has quietly been adding regular expression support to Excel, also known as regex. Instead of building up a few different text functions on top of each other, you can now use regex inside Excel formulas to search for patterns,…
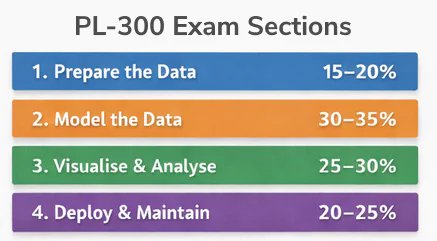
PL-300 and Our Power BI Training
If you are looking to pass the PL-300 Microsoft Power BI Data Analyst exam, you are probably wondering: Do Acuity Training’s Power BI courses actually prepare me for the exam? At Acuity Training, we do deliberately map our course content…
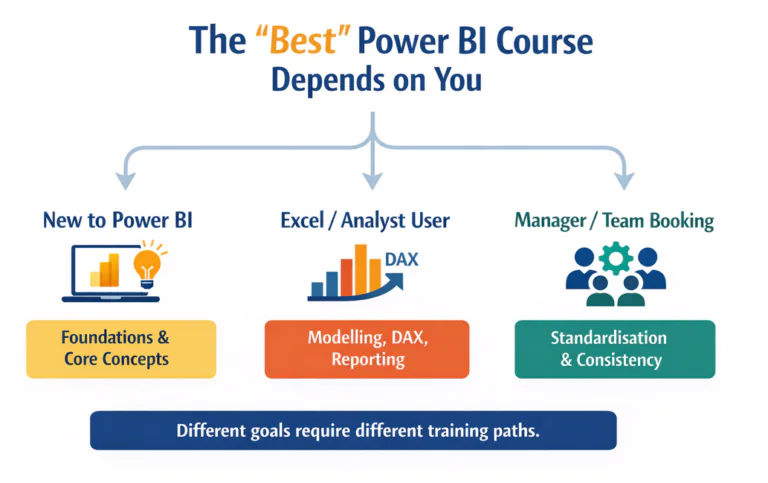
How To Pick The Best Power BI Course In London
If you are looking for the “best Power BI course in London”, you’ll find loads of different businesses, all telling you that they are the one to trust. However, there isn’t just one Power BI course that everyone should go…
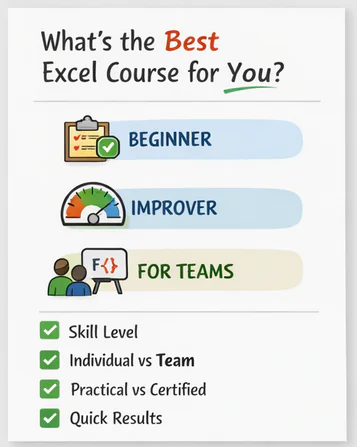
Best Excel Course In London (How To Actually Choose One!)
Search for “best Excel course in London” and you will get a dozen providers, all claiming to be the very best. In reality though, there isn’t just one best Excel course in London. When picking a course, you have to…
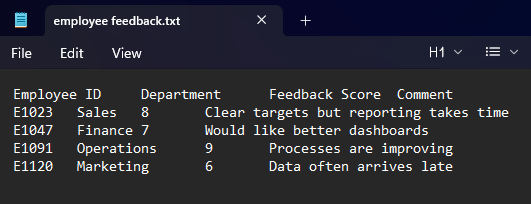
Excel’s New IMPORT Functions Explained – 2026
Microsoft just added some brand-new IMPORT functions, designed to make bringing external data into Excel easier! Instead of digging through menus or writing your own queries, you can now just use these new formulas, IMPORTTEXT and IMPORTCSV. Importing data is…

Power BI Courses – Buyers Guide 2026
So you want to go on a comprehensive Power BI course. Which one should you pick? Here’s a clear, numbered breakdown of six leading providers, all to help you make the right choice. To make this list, we reviewed dozens…
- Facebook: https://www.facebook.com/profile.php?id=100066814899655
- X (Twitter): https://twitter.com/AcuityTraining
- LinkedIn: https://www.linkedin.com/company/acuity-training/