Transform Your Excel Data [8 Easy Methods!]
Data is crucial for your business.
It offers insights into customer behaviour, and supports predictive forecasting for future product trends.
However, raw data is rarely usable as-is.
Issues such as missing values, duplicates, or errors can render datasets unreliable.
To make raw data usable, Excel data cleaning is a powerful solution.
What is Excel Data Cleaning?
Excel data cleaning finds corrupt or inaccurate data and corrects or removes it.
This process ensures your data is accurate and reliable.
This enables better decision-making and efficient operations.
If your organization performs inventory management but misses a department, the inventory is incomplete.
Just the same way, data cleaning ensures a complete and accurate picture by making sure everything is captured.
Key Tasks in Excel Data Cleaning:
- Duplication: Removes duplicate values, rows, and entries, ensuring unique records and transparency.
- Standardization: Formats data like addresses or dates to avoid confusion.
- Removal: Deletes irrelevant data, allowing for focused, high-quality analysis.
- Correction: Fixes typos and inaccuracies to eliminate reporting errors.
- Omission: Fills or removes gaps in datasets, improving data quality and reducing processing errors.
Common Challenges With Data Cleaning
Data cleaning, like any process, comes with its challenges:
- Volume: Handling large datasets can be overwhelming. Using cloud-based tools within Excel can improve performance and storage options.
- Dynamic Data: Real-time data requires cleaning in real time. Automation tools in Excel can streamline this process.
- Complexity: Combining data from multiple sources with different formats will require more advanced Excel skills.
8 Excel Data Cleaning Techniques
Let’s dive into the essential techniques for cleaning data in Excel.
These steps ensure your reports and analyses are based on accurate, high-quality data.
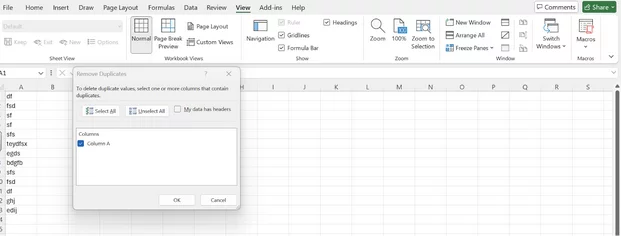
1. Removing Duplicates
Duplicate data can distort analysis. Here’s how to eliminate them:
- Select the column or range with duplicates.
- Navigate to ‘Remove Duplicates’ under the Data tab.
- Choose the columns you want duplicates removed from, and check the headers box if they are present in the dataset you’re working on.
- Click ‘ok’ when prompted.
You can also highlight the duplicate values if you just want to make them clear instead of removing them.
2. Standardizing Formats
Standardizing formats ensures consistent formats and structures across data from various sources.
For example, if you were preparing a report on technical debt meaning and costs, then you would need every piece of data to have the same format otherwise, some costs may not be calculated.
If you want to do any data analysis or calculations, then this is very important.
There are two ways to do this in Excel.
The first utilizes Power Query to detect and change structures and formats.
- Click on Power Query.
- Select the data source you wish to use.
- Go to Query > Edit.
- Choose the column you want to clean and then select Transform > Detect Data Type.
- Choose the format you want to change to from the drop-down menu.
Alternatively, you can use the Text to Column function.
- Choose the cell of the column you want to work with.
- Right-click on your choice and select Format Cells from the menu (or press ctrl+1 in Windows, cmd+1 for Macs).
- Choose the format you want to change to from the drop-down menu.
- Click OK.
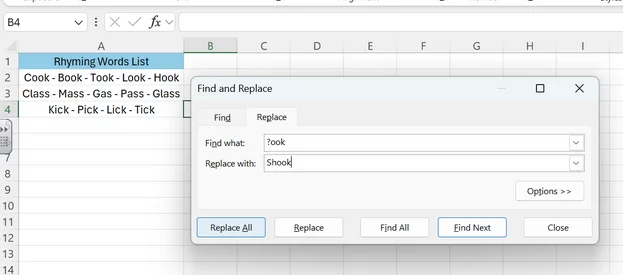
3. Find and Replace
When working with large datasets, you’ll often have the same values written in different formats.
Just like the date format, it’s essential that you have the values standardized.
Sadly, there is currently no way to do this for all the values you want to change.
This means that you need to replace all the highlighted values one-by-one.
- Choose the column or cell format you have identified as having different values.
- From Home, go to Find and Replace.
- In the Find box, enter the value you want to change.
- In the Replace box, enter the value you want instead.
- Click on Replace All if you wish to change all the same values on your datasheet. If not, just click OK.
4. Fixing Casing and Removing Extra Spaces
Even minor formatting issues such as the casing can affect any calculations can cause blank cells.
In every area of your data, you want consistent formatting.
Casing
This can be quite a manual and labor-intensive process, but it is a necessary one.
- Next to your text column, insert a new one and name it.
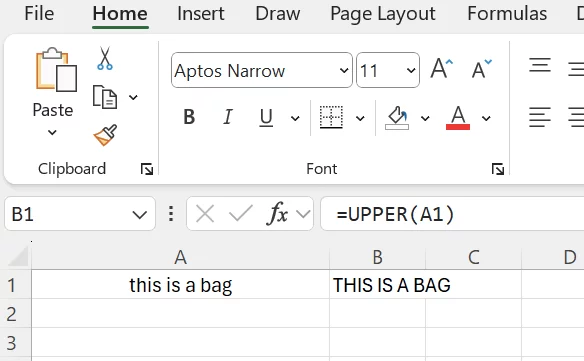
- In this new column, type out this formula:
=UPPER(cell address) – Converts to UPPERCASE
=LOWER(cell address) – Converts to lowercase
=PROPER(cell address) – Converts to Proper Case
- Drag the formula so that it applies to the entire range of cells in the text column.
- Copy the values you have in your new column and paste them in your text column.
- You can now delete the new column you created.
Extra spaces
If you see unnecessary spaces, then you can use Excel’s Trim function to remove them.
- As you did with casing, insert a new column next to the column you wish to trim.
- In the new column, type in the formula: TRIM(cell address)
- Drag the formula to all the cells you want to trim.
- Copy all the values from your new column and paste them to the original one.
- Delete the new column.
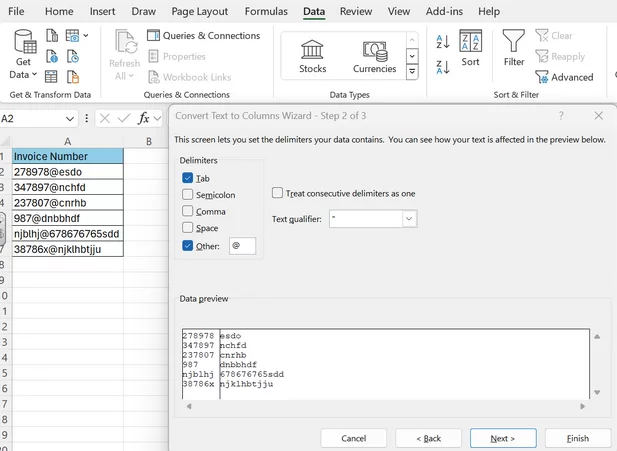
5. Splitting Delimited Data
When you have columns where the information is delimited by a space or a comma:
You need to split them into multiple columns before you process the data.
This is known as Data Parsing.
Be cautious when you define any of the destination columns.
You may find that the information contained in existing columns could be overwritten.
- Identify and select the column or cell containing text you want to parse.
- Choose Select Data > Text to Columns.
- Click on the Convert Text to Columns Wizard, then choose Delimited > Next.
- Decide on the delimiting terms such as Semicolon, Tab, etc.
- Click Next.
- Choose the destination cell for the split data.
- Select Finish.
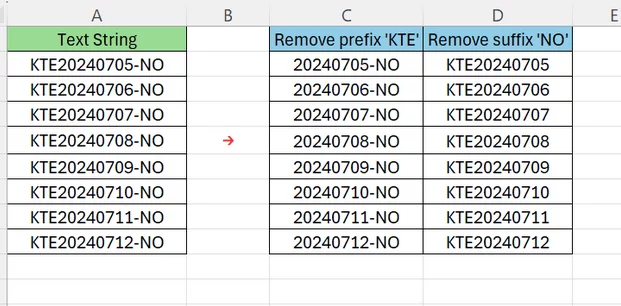
6. Extracting Prefixes and Suffixes
A lot of the values you see will nest valuable information with a prefix or suffix.
This is information that can be vital for good analyses.
However, it can be very difficult to use unless extracted as a separate value.
To extract prefixes and/or suffixes, you use the left and right functions in Excel.
- First, you create a new column adjacent to the one you’re going to extract text from.
- Select the column or cell you want to extract from.
- Type in this formula: =LEFT(text, [number of chars])
- Drag the rule to all cells you want it to apply to.
7. Spell Checks and Typos
Manual data entry is very prone to human error.
You should be checking for (and rectifying) any errors before moving to using your analytics tools.
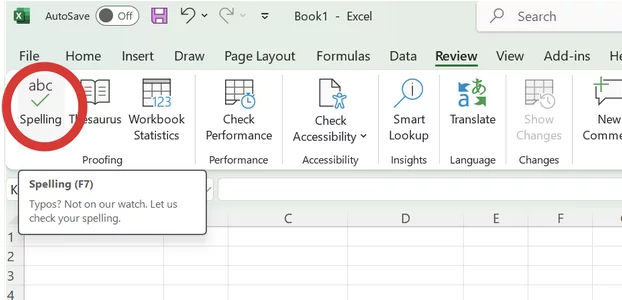
Luckily, Excel has a built-in Spellcheck tool that makes this an easy task.
- Choose the cell or column you want to check.
- Select Review > Spelling.
- Excel will suggest replacements where it identifies possibly wrong spellings.
- If there are no errors, you will see a checkmark displayed.
Note: Remember to set your language of choice!
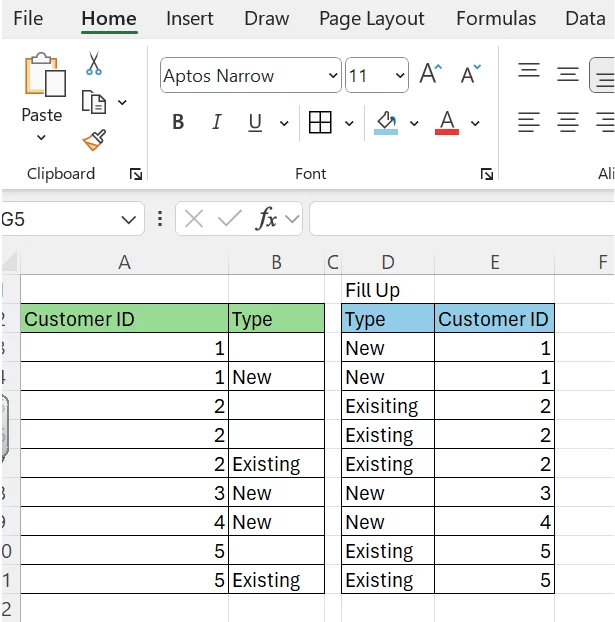
8. Filling Missing Values
Missing values can occur because of errors made during the data entry process.
When there are missing values, you can either remove them or replace them.
Ideally, you’d have no blank spaces or cells in your data, as complete data helps with data modelling and processing.
An exception to this is if the values are missing from a column you don’t intend using.
- Highlight the range from before to after any missing value.
- Select Home > Editing > Fill > Series
Note: For this to always work, the data needs to be in sequential order.
The Takeaway
Cleaning data is both difficult and important – but Excel can make it easy for you.
By mastering these simple techniques, you’ll ensure accurate and actionable insights for your business.
It’s the best way to get an accurate and effective analysis of any data.
- Facebook: https://www.facebook.com/profile.php?id=100066814899655
- X (Twitter): https://twitter.com/AcuityTraining
- LinkedIn: https://www.linkedin.com/company/acuity-training/

