
Microsoft Power BI
Our Power BI articles below clearly and simply how to use specific aspects of Microsoft Power BI that we also cover in our Power BI training courses.
AllAdobe IllustratorAdobe InDesignAdobe PhotoshopAutoCADGuides & TipsManagementMicrosoft AccessMicrosoft ExcelMicrosoft Power AutomateMicrosoft Power BIMicrosoft PowerPointMicrosoft ProjectMicrosoft SharePointMicrosoft WordNewsResilienceSQLTime Management

3 Top Tips From 15 Power BI Experts!
Power BI is incredible, but not the most intuitive product out there. Knowing it is a requirement for great jobs, but how can you start your journey? There are a lot of online resources available for learning Power BI, such…

Introduction To Power BI Slicers [Beginners Guide: Step-By-Step]
Slicers are a great way to visually filter your data. They offer a much more appealing alternative to filters, but achieve the same goal: Digging deep into your data and making subsets based on your needs. Let’s get straight…
You Should Learn Power BI [How And Why]
Power BI stands for Power Business Intelligence. It is the leading business intelligence and data visualization tool. Microsoft Power BI’s transforms data from multiple sources into actionable insights. It is used by business analysts, business intelligence analysts and supply chain…

[Power BI Security] 7 Quick Tips To Get Started!
One of the most valuable features of Power BI is its security features. They’re comprehensive and easy to work with – a rare combination! This beginners’ article looks at Power BI’s top 7 security features. Power BI has plenty more…

All About Power BI Templates (With Download Links!)
Templates are critical to increasing your work speed as you become a more advanced Power BI user. This article walks you through what they are and how to use them in detail with the help of an example. Templates are…
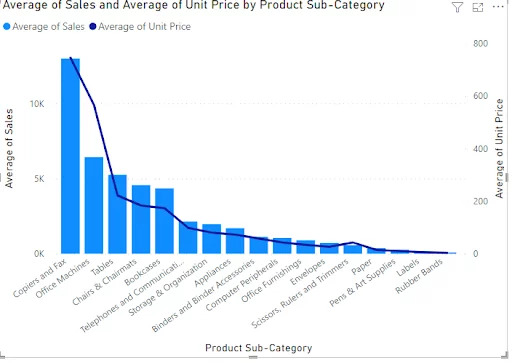
Creating A Combo Chart (Two-Axis Chart) In Power BI
In this article, you will learn how to quickly create and edit the formatting of Power BI combo charts. Combo charts are dual-axis charts (they have a secondary Y-axis), making them great ways to compare two different datasets against another…

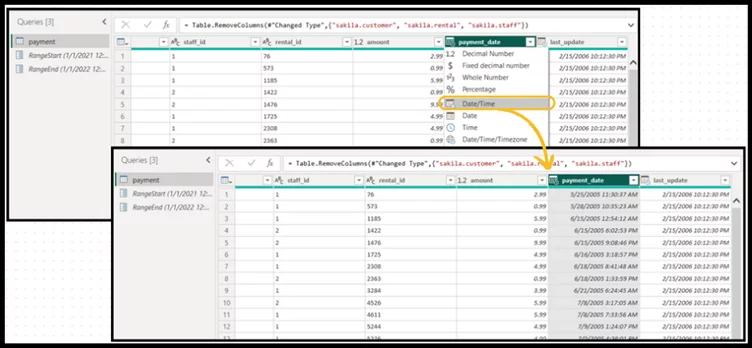
Understanding Merge Queries & Append Queries [Power BI Guide]
In this article, we will walk step-by-step through how to use Power BI merge queries, and Power BI append queries to combine data or for data preparation. You will also learn to use fuzzy matching features when merging queries in…

Power BI Vs Tableau: A Detailed Analysis
Choosing the proper business intelligence and data analytics tool is crucial to making timely and informed decisions with business data. A good business intelligence tool must offer a combination of power, ease of use, affordability and the ability to work…

Customer Case Study: Rennie Grove Peace – Power BI Training – April 2024
Claire Caple – Microsoft 365 Adoption & Change Manager – Rennie Grove Peace “Alpesh was very knowledgeable, and I was confident in his training from the start. He was enthusiastic and excited to help us get to know the software.…
Incremental Refresh – Optimising Power BI
Optimising Power BI reports is crucial when it comes to speed and performance. Incremental refresh allows you to keep historical data (previously loaded data) within your data source and only refresh the data that is changing. Schedule refresh, on the…

Master The Bullet Chart In Power BI – 5 Minute Guide
A Power BI bullet chart is a more advanced type of bar chart and great for plotting data comparisons. Each bar is shown against multiple qualitative ranges and a target, making it really easy to monitor progress. A bar plot…
The Q&A Visual In Power BI
The Q&A visual in Power BI uses Power BI’s natural language processing engine. It can interpret your question and get an answer from your data. Half of Power BI is learning the best way to present your data using…